Image Credit: NASA
One of the most visible signs of climate change in recent years was not even visible at all until a few decades ago.
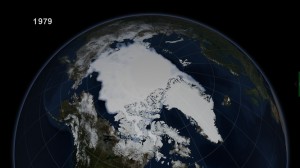
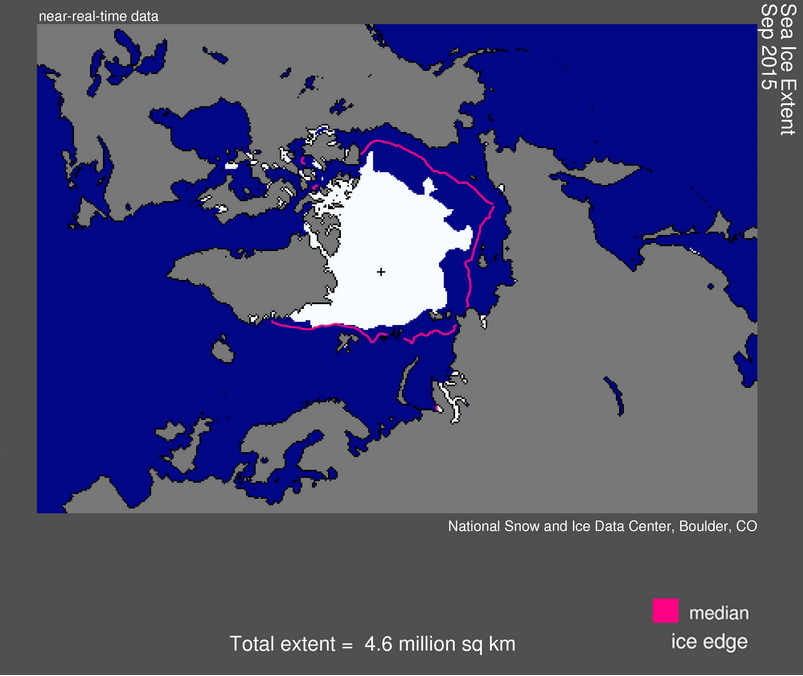
The sea ice cap that covers the Arctic Ocean has been changing dramatically, especially in the last 15 years. Its ice is thinner and more vulnerable – and at its summer minimum now covers more than 1 million fewer square miles than in the late 1970s. That’s enough missing ice to cover Alaska, California and Texas.
A key part of the story of how the world was able to witness and document this change centers on meticulous work over decades by a small group of scientists at NASA’s Goddard Space Flight Center in Greenbelt, Maryland. Late nights in mainframe rooms, double- and triple-checking computer printouts, processing and re-processing data – until the first-ever accurate atlases of the world’s sea ice were published.
 “Sea ice was one of the least understood variables in the Earth system,” said Claire Parkinson, a climate change senior scientist at NASA Goddard. “Thanks to satellites, now sea ice is one of the best studied components of the planet.”
Getting off the Ground
In the early 1970s, NASA was reaping accolades for putting men on the moon. The Apollo program was still up and running, and moonwalking astronauts were NASA’s face to the world.
But in lesser-known corners of the agency, scientists were laying the foundation for the modern era of using space as a means to look back at Earth. A few scientists thought they could use this vantage point to map the previously unmappable – the sea ice surrounding Antarctica and covering the Arctic Ocean.
“NASA was anxious to determine how much could be learned about the Earth from the new perspective provided by satellites,” Parkinson said, “and sea ice was one of the important climate variables being examined.”
Sea ice is always changing – pushed and pulled by winds and ocean currents, melting and freezing depending on the season. And unless you get above it – with a satellite – it’s nearly impossible to see at once how much area it covers, the shape it takes and its seasonal variations.
The first satellites to take a peek at the sea ice cover had been the multi-agency Television Infrared Observation Satellite (TIROS) weather satellites launched by NASA and others in the 1960s. But these spacecraft had only visible and infrared sensors. Thick cloud cover and the long, dark Arctic winter limited their ability to provide continuous sea ice coverage.
To solve this problem, scientists at NASA Goddard had developed a prototype instrument capable of recording the naturally occurring microwave radiation that comes from objects on the Earth’s surface and the atmosphere. To this instrument, clouds were not obstacles and daylight was not necessary.
A series of aircraft research flights in 1967 and 1970 demonstrated its potential. The flights over Arctic sea ice in a NASA aircraft showed the strong contrast between the ice-free ocean and sea ice when observed at microwave wavelengths.
The instrument, the Electrically Scanning Microwave Radiometer (ESMR), launched into space aboard the Nimbus 5 satellite on December 10, 1972.
The game was changed, according to Don Cavalieri, a senior research sea ice scientist at NASA Goddard who led some later testing and validation airborne campaigns starting in the 1980s. The Goddard scientists could now calculate estimated sea ice concentrations within each 18.6-mile (30-kilometer) pixel of the satellite images.
“With satellites, it was the first time we got a global view of what’s happening with the sea ice cover,” Cavalieri said. “We saw that there were not only seasonal variations, but large interannual variations as well.”
Making Sense of the Data
But, while data on sea ice extent were now flowing from space to Earth, the scientists’ work had just begun. The early-era satellite instrument and limited computing power of the day provided plenty of challenges for the Goddard scientists before they could produce accurate sea ice maps.
Some of the images ESMR provided were sharp. Others had “fuzzy” pixels or obviously flawed radiation data, recalled Jay Zwally, a senior scientist at Goddard. In 1974, Zwally, a physicist who had been Program Manager for Glaciology and Remote Sensing at the National Science Foundation, came to NASA’s Goddard campus attracted by the potential he saw in ESMR for year-round, global observations of sea ice.
“We never found the cause of the intermittent glitch – there was speculation that maybe there was a little piece of solder inside the instrument that would occasionally short out something, which would cause the data to be uncalibrated,” Zwally said.
The microwave radiometer also had a geolocation problem – at times it would stick a segment of data in the wrong place. Scientists found and removed the misplaced and flawed data. In 1977 Zwally recruited Josefino Comiso, a physics-trained scientist, to process ESMR data. Comiso described the process as “painstaking. Because it could not be done digitally – it had to be done manually.”
Scientists used a mainframe computer and all the data were kept on 12-track tapes. There was only one of these million-dollar computers on the Goddard campus, which processed all the data from all the satellites in orbit controlled by the center.
“You had to sign up to use the computer, and sometimes you’d get a time slot in the middle of the night,” Comiso said.
To look at the microwave data, the scientists would first produce 18-inch paper printouts. Zwally wrote a program to delineate the ice edge and sea ice concentrations. From there, the researchers created tapes with the data that would be read by a film recorder called a Dicomed, which produced Polaroid images of sea ice.
“We then looked at the images and would recognize when data didn’t belong in there – erroneous data would just stand out,” Comiso said. “For example, we knew that in Antarctica the sea ice goes around the continent and the ice edge is continuous, so if there was a pattern that disrupted the ice edge, we’d know for sure it was wrong data.”
After years of meticulous work, Zwally, Comiso, Parkinson, Cavalieri and colleagues Per Gloersen, Bill Campbell, and Frank Carsey published the ESMR images in two atlases of sea ice. An Antarctic atlas led by Zwally was published in 1983, an Arctic atlas led by Parkinson in 1987.
They were the first of their kind ever published.
“The Soviets were so impressed that they translated them into Russian, reproducing our color pictures,” Comiso said.
Seelye Martin – now a professor emeritus of oceanography at University of Washington – remembers that the atlases made an impact.
“The ESMR atlases got a lot of attention because this was the first collection ever of monthly sea ice images that actually showed not only the ice edge – which people had known from ships and aircraft – but also the ice interior,” Martin said.
The monthly images showed how polar sea ice varies with the seasons and years. This kind of data is now converted to digital maps immediately and is available widely on the Internet. That was not the case in the late 1980s.
“Ships traveling in the Arctic and Antarctic would take these books with them, because nobody had ever shown them such detail regarding what to expect in which months and what kind of variability you can have from one year to another,” Parkinson said. “Now it’s very different, as now someone on a ship can get satellite data delivered to his or her computer within hours of when the data are collected.”
Toward the Modern Era
On October 24, 1978, NASA’s Nimbus 7 satellite launched carrying the Scanning Multichannel Microwave Radiometer (SMMR). Compared to ESMR, SMMR’s 10 channels allowed scientists to distinguish young ice that had recently formed from thicker and older ice that had been around for several years.
But Martin recalls that SMMR had its own suite of problems. “There was a lot of cross-talk between channels and it had a peculiar way of scanning,” said Martin, who worked with SMMR data. These shortcomings would get solved in the next generation of sea ice instruments, the Special Sensor Microwave/Imager (SSM/I), a microwave radiometer system flown on board satellites of the United States Air Force Defense Meteorological Satellite Program. SSM/Is have been operating almost continuously since June 1987.
NASA was tasked with the development work, then after a satellite technology was tested and seen to be of value, it would be handed to NOAA or the Department of Defense for long-term operations, Parkinson said.
“By the launch of SSM/I, it was a lot easier to work with the satellite data. The algorithms had finally settled down and been validated, plus people had desktop computers so the analysis was much easier,” Martin said. “It would be fair to say that most of the groundwork was done with ESMR and SMMR, and that SSM/I only required making some adjustments.”
Unlike the Nimbus 5 and Nimbus 7 missions, separated by a gap of over two years, SSM/I and SMMR overlapped in space for a few months, allowing researchers to compare and calibrate their datasets and create a nearly uninterrupted sea ice record starting in November 1978.
Cavalieri, Zwally, Comiso and Parkinson are still active at Goddard today. Algorithms authored by the Goddard scientists remain among the most widely used to detect sea ice coverage from satellite-based microwave instruments. Comiso is one of the coordinating lead authors on the cryosphere chapter of the U.N.’s Intergovernmental Panel on Climate Change Fifth Assessment Report, and all four of the scientists have served on relevant national and international committees.
The goal of establishing how to measure and record the changing extent of sea ice in both polar regions was largely accomplished by the end of the 1980s. But in the following years — as it became clear that sea ice in the Arctic was undergoing fundamental changes — this newly established record would become far more important than a simple a tool for ship navigators. Scientists were in for a big surprise.


