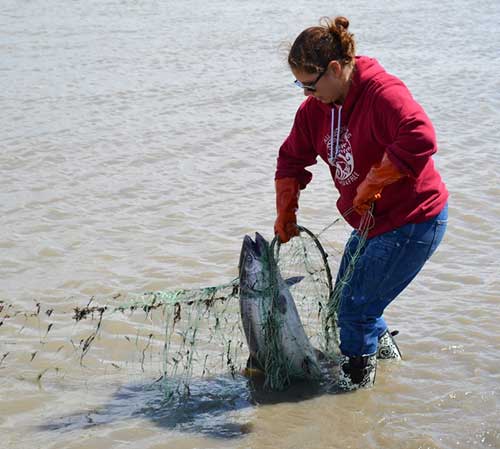
With over 30,000 km of shoreline, Alaska is home to some of the world’s richest fisheries. In Southeast Alaska, like much of the state, coastal communities depend on commercial and subsistence fisheries for their livelihood. With such a vast and varied environment, obtaining long-term oceanographic data is challenging, limiting understanding of patterns and the ability to predict long-term change in habitat and distribution of vital Alaskan fish populations.
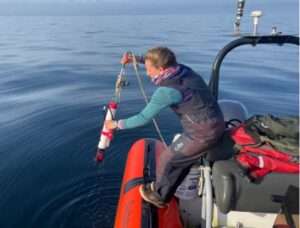
As a part of the Southeast Alaska Ocean Trolling Vessel Measurement Program facilitated by Alaska Sea Grant, University of Alaska Fairbanks graduate student Dana Bloch has been working to overcome this challenge. Through combined efforts of UAF College of Fisheries and Ocean Sciences oceanographer Tyler Hennon, Alaska Sea Grant Marine Advisory Program agent Sunny Rice and Alaska Trollers Association board member Jim Moore, the project partnered with ATA and the Alaska Whale Foundation to deploy oceanographic instruments called CTDs—which measure water conductivity, temperature and depth—across the region. The measurements can be used to estimate the density of seawater, which helps determine how Southeast Alaskan waters circulate and mix and ultimately impacts marine organisms of all sizes.
“Using all of the CTD data we have collected thus far, it is clear that salinity is the primary driver of density patterns in Southeast Alaska,” said Bloch. “Looking at the ATA cast data, we see low surface salinity in roughly June through October or November, and then higher surface salinities in the winter.”
This seasonal difference is due to a variety of factors. Spring brings freshwater from ice and snowmelt into Alaskan oceans, while late summer and fall typically pours increased precipitation into the system. This freshwater sits largely in a layer at the surface. With a relatively high density difference between the surface and deeper waters and few high-wind storms, the upper water column in the summer is strongly stratified. In contrast, the winter months experience less freshwater input, have frequent high-wind storms, and undergo strong cooling at the air-sea interface. These conditions mix the water column more thoroughly, resulting in a more uniform water column and higher salt content at the surface.
Bloch’s data also indicates a strong relationship with surface salinity and distance from the mainland, which has the largest source of freshwater input from river water and glacial melt. Areas close to the mainland have consistently lower salinities at the surface than those closer to open ocean and thus also have the strongest stratification.
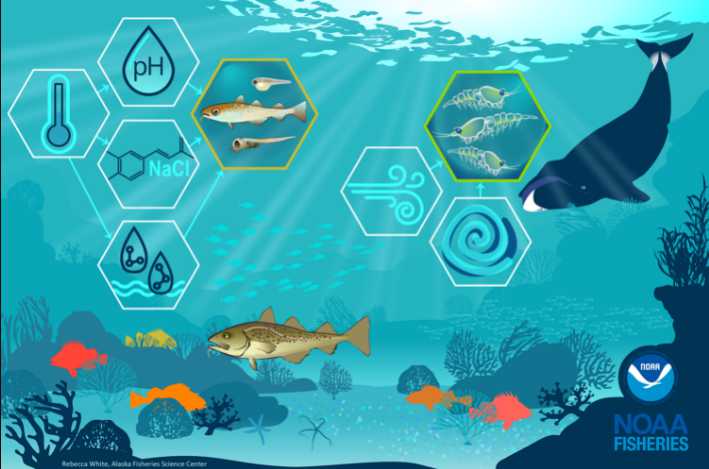
“Salinity and stratification patterns are important to understand as they impact surface nutrient concentrations, which in turn impact local primary productivity,” Bloch explained. “On a simple level, an area with strong stratification and less mixing between surface and deep waters may have less nutrient replenishment in the surface compared to an area with weak stratification.”
Stratification is important as it sets the stage for primary productivity, which in this system can be thought of as phytoplankton growth and reproduction. For a bloom to occur, phytoplankton need to stay mostly within the well-lit ocean surface, while receiving high nutrient concentrations which can be caused by mixing. This is a balance that’s difficult to achieve. Bloch is currently examining the relationship between salinity, stratification and nutrient concentrations.
“I’m still working to parse out these relationships as the patterns can be a bit more complex,” Bloch explained. “There are further complications because the inputs of freshwater that cause surface stratification bring terrestrial nutrients into the system, and different freshwater sources could contribute different types and concentrations of nutrients. This is a relationship I am still working to resolve using the CTD data and nutrient concentration data from water samples I collected from 2021 to 2023.”
Bloch aims to conduct additional research including potential identification and prediction of primary productivity hotspots based on oceanographic measurements, and ultimately map the connections between oceanography in the region and habitat use by fish and whales.
“Ultimately, these data and the resolution of these relationships may help inform our understanding of how this system works and why certain areas are more productive than others,” Bloch said. “As climate change persists, we expect the freshwater inputs in this area to change, perhaps increasing initially with increased glacial melt, and maybe ultimately decreasing. A better understanding of this system as it is today may help those who rely on this ecosystem for food and income adapt to future changes.”
Learn more about additional research conducted by the Southeast Alaska Trolling Vessel Ocean Measurement Program.


