- Greenland ice sheet: Melting occurred across almost 40 percent of the surface of the Greenland ice sheet in summer 2014; for 90 percent of the summer the extent of melting was above the long-term average for the period 1981-2010; and the number of days of melting in June and July exceeded the 1981–2010 average over most of the ice sheet. In August 2014, the reflectivity (albedo) of the ice sheet was the lowest observed since satellite observations began in 2000. When less of the sun’s energy is reflected by ice, melting increases. The total mass of the ice sheet remained essentially unchanged between 2013 and 2014.
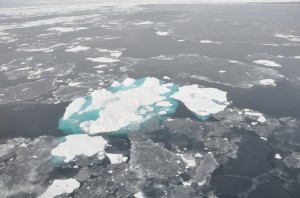
- Arctic Ocean productivity: Declining sea ice is leading to an increase in sunlight reaching the upper layers of the ocean, setting off increased photosynthesis and greater production of phytoplankton, tiny marine plants which form the base of the food chain for fish and marine mammals. The timing of phytoplankton blooms throughout the Arctic Ocean is also being affected, with more frequent secondary blooms during the fall. In June, July and August 2014 the highest primary production – occurred in the Kara and Laptev seas north of Russia.
- Vegetation: On land, peak tundra greenness, a measure of vegetation productivity and biomass, continues to increase. Between 1982 and 2013, the tundra biomass has increased by 20 percent. However, tundra greenness integrated over the entire summer shows a browning trend occurring in Eurasia, where summer air temperatures have also been decreasing.
“The Arctic Report Card 2014 presents observations vital for documenting the state of the Arctic environmental system, understanding the complex interactions and feedbacks within the system, and predicting its future,” said Martin Jeffries, Ph.D., principal editor of the 2014 Report Card, and Arctic Science Advisor and Program Officer for Arctic and Global Prediction, Office of Naval Research. “Observing, understanding and predicting are essential elements of the Arctic Research Plan of the Inter-agency Arctic Research Policy Committee and the implementation of the U.S. National Strategy for the Arctic Region.”
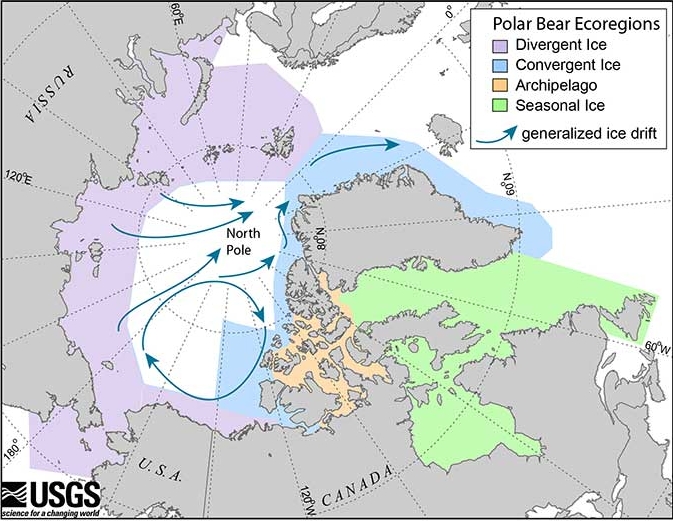
A special essay in this year’s report card, written by the Norwegian Polar Institute and Polar Bears International, assesses polar bear populations in some areas where good long term data are available. The most recent data shows that a population decline in western Hudson Bay, Canada, was due to earlier sea ice break-up, later freeze-up and, thus, a shorter sea ice season. Polar bears depend on sea ice to travel, hunt, and mate, and in some areas, to den. Data shows that polar bear numbers had stabilized in the southern Beaufort Sea, after about a 40 percent decline since 2001. Polar bear condition and reproductive rates in the Chukchi Sea have been stable for 20 years, where sea ice is also declining though not as rapidly as in the southern Beaufort Sea.
In 2006, NOAA’s Climate Program Office introduced the State of the Arctic Report which established a baseline of conditions at the beginning of the 21st century. It is updated annually as the Arctic Report Card to document the often-quickly changing conditions in the Arctic. To view this year’s report, visithttps://www.arctic.noaa.gov/reportcard/.
Pages: 1 2

