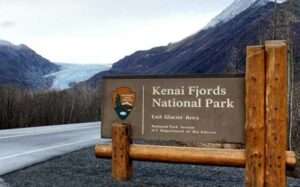
For National Parks Week, Travel Lemming analyzed data to rank all 63 US national parks. Kenai Fjords was the best-performing park in Alaska, ranking at #15 overall. Meanwhile, Kobuk Valley and Gates of the Arctic came in at #63 and #62, respectively.

Denver – In celebration of National Parks week, Travel Lemming released a data-backed ranking of all 63 US national parks. Out of Alaska’s 8 national parks, Kenai Fjords was the only one to crack the top 20. Meanwhile, Kobuk Valley and Gates of the Arctic came in at the bottom of the pack, largely due to reviews and weather.
Travel Lemming’s national parks ranking is based on an analysis of data scoring each park across six factors: affordability, accessibility, biodiversity, crowds, reviews, and weather.
The report revealed the following national park insights:
-
The overall rankings of Alaska’s national parks are: Kenai Fjords #13, Katmai #21, Denali #36, Wrangell-St. Elias #39, Lake Clark #43, Glacier Bay #48, Gates of the Arctic #62, and Kobuk Valley #63.
-
All 8 of Alaska’s national parks ranked in the Top 15 for crowds, with Gates of the Arctic coming in #1 overall.
-
Alaska’s national parks were all over the map when it came to reviews. Both Kenai Fjords and Glacier Bay tied at #1, while Gates of the Arctic came in #61, Kobuk Valley came in #62, and Wrangell-St. Elias came in #58. Katmai made the Top 10 best-reviewed list at #9.
-
Weather was a determining factor in the low rankings of Alaska’s parks. Kenai Fjords, Katmai, Denali, Wrangell-St. Elias, Lake Clark, and Glacier Bay all tied at #53. Meanwhile, Gates of the Arctic came in at #63, and Kobuk Valley at #62.
-
Tennessee’s Great Smoky Mountains is the most biodiverse park, North Dakota’s Theodore Roosevelt the most affordable, Alaska’s Gates of the Arctic the least crowded, and Missouri’s Gateway Arch the most accessible.
-
Shenandoah National Park ranks 1st overall, with exceptional scores in affordability, accessibility, and biodiversity.
-
Several lesser-known parks rank in the top 20, challenging conventional ideas of the top US national parks.
The top 10 US national parks in the USA according the report are:
|
Ranking |
National Park Name |
State |
|
1 |
Shenandoah National Park |
VA |
|
2 |
North Cascades National Park |
WA |
|
3 |
Biscayne National Park |
FL |
|
4 (tie) |
Kings Canyon National Park |
CA |
|
4 (tie) |
Sequoia National Park |
CA |
|
6 |
Everglades National Park |
FL |
|
7 |
Big Bend National Park |
TX |
|
8 |
Mammoth Cave National Park |
KY |
|
9 |
Death Valley National Park |
CA, NV |
|
10 |
Channel Islands National Park |
CA |
The most famous national parks fared surprisingly poorly in the data, largely due to the crowds and affordability factors. Grand Canyon National Park was ranked #15, Yellowstone National Park at position #23, and Yosemite National Park at slot #34.
Travel Lemming Senior Travel Writer McKenna Mobley commented: “I have traveled the world, and can confidently say that the USA national parks are unparalleled, making them one of my all-time favorite travel destinations. Every US national park offers its own special flair, so in some sense ranking them is like ranking music genres — they’re all good!”
“However, I hope this report highlights the fact that some of America’s less famous parks offer far more than what meets the eye. Sometimes the best experiences can be found at hidden park gems that are off the lemming path.”
National Parks were ranked on six factors, based on the following data:
-
Crowds – Number of visits per acre of park land in 2022. (Sources: NPS 2022 Recreation Visit Data, Wikipedia Acreage Data)
-
Reviews – Average visitor review score out of 5. (Sources: Google Maps, Yelp, TripAdvisor)
-
Weather – Number of months with a comfortable average temperature, defined as between 50 and 90 degrees fahrenheit. (Source: NOAA NECI US Climate Normals)
-
Affordability – Average nightly cost of a nearby quality hotel room during the first weekend of the park’s most popular month. (Sources: Booking, Google Travel, Hotel Websites)
-
Accessibility – Average of driving distance to the park from the closest FAA Primary Airport and from the closest hub airport. (Sources: FAA, Google Maps Driving Distance, Wikipedia Major US Airports)
-
Biodiversity – Number of species deemed “present or probably present.” (Source: NPS Species List)
Overall rankings were determined by each park’s average ranking across all factors. Further details are available in the report’s methodology section.
[content id=”79272″]


